
How Much Should a Dealership Spend on Digital Marketing?
How Much Should a Car Dealership Spend on Digital Marketing Each Month?
Every dealership asks the same question. How much should you put into digital marketing each month? The right number depends on your store's size, market, and sales goals, but published industry data gives you a defensible starting point instead of a guess.
How Much Should a Car Dealership Spend on Digital Marketing Each Month?
A typical franchise dealership spends close to $36,600 a month on digital marketing alone. That figure comes from NADA Data's 2025 finding that the average store spends $586,246 a year on advertising, with roughly 75 percent of every dollar now going to digital channels. Total advertising spend across every channel, digital and traditional combined, averages $739 for each new vehicle a dealership sells, according to NADA.
Dealers United builds monthly digital budgets around a store's unit volume and cost per car sold rather than a fixed rule of thumb, and treats these NADA benchmarks as the starting point for that conversation, not the final number.
How Much Does the Average Dealership Spend on Marketing Each Year?
NADA Data puts the average franchise dealership's total advertising spend at $586,246 a year, up 7.8 percent from the prior year. Spread evenly, that works out to roughly $48,850 a month across every channel a store uses, before splitting out digital from traditional. Total spend also runs at 0.77 percent of a dealership's gross revenue, down from 1.00 percent a decade ago. Stores are spending more in raw dollars while that spend shrinks as a share of revenue, a sign that dealerships are getting more efficient with each ad dollar rather than simply spending more.
Ten years ago, the average dealership spent $520,029 a year, or $633 per vehicle sold, with 1.00 percent of revenue going to advertising. Total spend has grown by more than $66,000 a year since then, and NADA's cost-per-vehicle figure has climbed from $633 to $739. Rising unit prices and tighter inventory competition both play a role, and so does the growing cost of earning attention across more digital channels than existed a decade ago.
Dealers United tracks these national figures against real client media buys rather than treating them as a ceiling or a floor. For a fuller breakdown of channel-by-channel performance benchmarks, see the car dealership digital marketing benchmarks guide.
What Share of That Budget Should Go to Digital?
Digital media accounted for 74.9 percent of dealer ad spending in 2025, per NADA Data, with the remaining 25.1 percent split across television, radio, direct mail, and newspaper. Applied to the $586,246 average, that puts digital spend at roughly $439,200 a year, or about $36,600 a month, the number most dealer principals should use as their working monthly digital target. Traditional media still earns a place in the mix, but the direction of the split has held steady for years. Digital keeps gaining share, and traditional keeps losing ground.
The remaining 25 percent splits across the traditional channels franchise dealers still rely on. Television carries the largest traditional share at 10.5 percent of total ad spend, radio has fallen to 6.9 percent from 16.1 percent a decade ago, direct mail holds 5.6 percent, and newspaper is down to 2.1 percent. Streaming has picked up share within that television line item as broadcast viewership declines, which is why Dealers United treats streaming TV advertising as its own line item rather than folding it into general digital display.
None of these traditional channels are disappearing outright, but the trend line has run one direction for a decade straight. A monthly budget built around a 75/25 digital-to-traditional split reflects where the market has already moved, not a prediction of where it might go.
Not Sure Your Search Budget Matches Your Market?
Get a free strategy review and see how your current spend compares to what a competitive search program costs where you sell cars.
Where the Digital Dollars Go
Search claims the largest single share of a dealership's digital budget. NADA Data shows search engine marketing at 21.1 percent of total ad spend and SEO at 19.5 percent, a combined 40.6 percent, more than any other category. Third-party listing sites take another 20.0 percent, and social media advertising has grown to 14.2 percent of total spend, up from 12.7 percent the year before.
Nearly half of the digital budget goes to search alone, between paid search and SEO. That is where the modern car shopper starts, researching models, comparing trims, and checking local inventory before ever filling out a lead form. A budget that under-funds search is under-funding the first and most decisive step in the shopper's path, no matter how strong the rest of the marketing mix looks.
Search now covers more than a ranked list of blue links. Buyers increasingly start their research inside AI tools and Google's AI Overviews, not just a traditional results page, which is why Dealers United treats generative engine optimization as part of the same search budget as SEO and paid search rather than a separate line item. A dealership that shows up in AI Overviews and ChatGPT answers captures shopper attention earlier than one that only shows up in the ten blue links below them.
Key takeaway
Search, paid and organic combined, claims close to 40 percent of the average dealership's ad budget. A monthly digital plan that shortchanges search is shortchanging the channel buyers use first.
How Should Monthly Budget Scale With Store Size?
NADA's $739-per-vehicle figure gives every dealership a simple starting formula. Multiply your average monthly new-vehicle unit sales by $739 to estimate a reasonable total monthly ad budget, then apply the 75 percent digital share to estimate the digital piece of that number.
| Monthly New-Vehicle Sales | Est. Total Monthly Ad Budget | Est. Monthly Digital Spend |
|---|---|---|
| 50 units | ~$36,950 | ~$27,700 |
| 100 units | ~$73,900 | ~$55,400 |
| 150 units | ~$110,850 | ~$83,100 |
| 250 units | ~$184,750 | ~$138,600 |
Scroll the table horizontally to see all columns on mobile.
Treat this table as a floor for the conversation, not a finished budget. A store in a competitive metro market with five rival dealerships bidding on the same search terms needs more than a store with the same unit volume in a market with one competitor. Franchise requirements, inventory turn, and how much ground a store needs to make up in search rankings all push the real number up or down from this baseline. Pair this baseline with real performance data rather than spend alone. Dealers United's guide to automotive analytics for car dealerships covers which metrics tell you if the budget is working.
Flat Fee vs. Percentage vs. Bundle: Comparing Pricing Models
Once you know roughly what to spend, the next decision is how your agency gets paid for spending it. Three pricing models cover most of the market, and each one changes the incentives in the relationship.
| Pricing Model | How It Works | Best For | Watch Out For |
|---|---|---|---|
| Flat monthly fee | A fixed management fee, set independent of how much media you spend. | Stores that want a predictable line item and an agency incentivized by results instead of budget size. | Confirm what is included. Creative, landing pages, and reporting sometimes bill separately even under a flat fee. |
| Percentage of ad spend | The management fee grows automatically as your media budget grows. | Stores comfortable letting spend scale with sales goals without renegotiating a contract. | The agency's incentive is to grow your spend, not necessarily your results. Ask how performance gets measured apart from budget size. |
| Bundled package | A fixed set of deliverables and channels sold at set price points. | Smaller stores or a single channel that wants price certainty. | Packages can lock you into channels that do not fit your market, or leave out one your store needs. |
Scroll the table horizontally to see all columns on mobile.
Dealers United charges a flat monthly management fee rather than a percentage of ad spend, on the theory that an agency should not get paid more just because it recommends spending more. Whichever model your store chooses, ask the agency to show its math openly rather than accepting a package price without knowing what drives it. See how nine other agencies structure pricing and specialization in Dealers United's best automotive digital marketing agencies comparison.
What Should You Ask Before You Commit to a Marketing Budget?
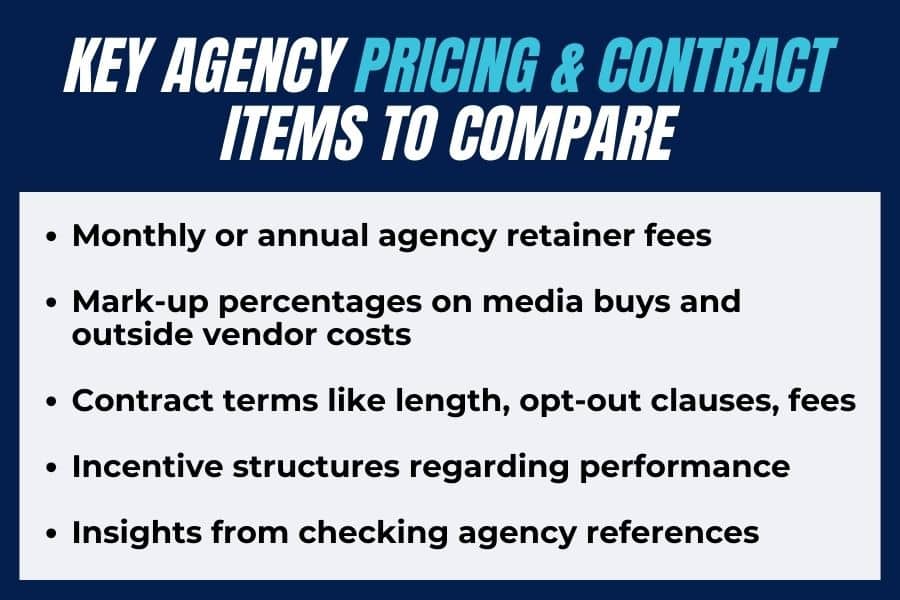
A monthly number means little without knowing what it buys. Ask an agency these questions before signing anything.
- What is included in the fee, and what costs extra? Creative production, landing pages, and call tracking are common add-ons that turn a competitive quote into an expensive one.
- How is the budget split across channels, and who decides that split? A plan built around what the agency prefers to sell is not the same as a plan built around where your buyers search.
- What is the minimum commitment, and what does canceling look like in practice? Long lock-in periods paired with vague exit terms are a common way agencies protect weak performance.
- How is performance reported, and against what metric? Leads are easy to inflate. Cost per car sold and matched sales are harder to fake and closer to what the budget pays for.
- Does a dedicated person own your account? A rotating point of contact is often the first sign of an understaffed agency.
- How does the budget adjust as your unit sales or market competitiveness change? A number that fits your store today should not stay fixed for three years.
- Does search get a share proportionate to how buyers shop? A budget weighted toward the agency's favorite channel instead of search is a budget built backward. Dealers United's best automotive SEO agencies guide covers what a search-first program looks like in practice.
How Do You Know If You're Overspending or Underspending?
Compare your total ad spend to your gross revenue, not just to the national dollar average. NADA's 2025 ad-to-sales ratio sits at 0.77 percent, down from 1.00 percent ten years ago. A store running well below that ratio, especially in a competitive market, is often losing share to competitors who show up first in search and paid results. A store running well above it is not automatically wasting money either. A newer store, or one entering a competitive market, often needs a heavier initial push to build search visibility and brand recognition before spend can taper toward the average.
Ratio to revenue matters less than what each dollar produces. Dealers United reports every client program against cost per car sold rather than raw lead volume, because a cheap lead that never turns into a matched sale is not cheap.
- Power Ford: 4,210 leads at $11.84 per lead, a 33 percent reduction in cost per lead.
- Honda of DTLA: 723 units sold in six months at $89.07 per matched sale.
See more verified results across dealer partners in Dealers United's case studies library.
Key takeaway
Compare spend to revenue and to cost per car sold together. A budget that looks efficient on a spreadsheet and a budget that sells cars are not always the same number.
Want a Budget Built Around Cost Per Car Sold?
Book a call and get a media plan sized to your store's unit volume, market, and sales goals, not a generic percentage.
Frequently asked questions
How much should a car dealership spend on digital marketing per month?
Using NADA's $739-per-vehicle ad cost average and its 75 percent digital share, a dealership selling 50 new units a month should budget roughly $27,700 a month for digital marketing, a 150-unit store roughly $83,100, and the industry-wide average across all franchise stores works out to about $36,600 a month. Your market's competitiveness and your store's inventory turn move the real number up or down from these estimates.
What percentage of a dealership's marketing budget should go to digital?
NADA Data puts digital at 74.9 percent of total dealer ad spend in 2025, with the remaining 25.1 percent split across television, radio, direct mail, and newspaper. That share has grown every year NADA has tracked it and shows no sign of reversing.
How much does the average dealership spend on advertising per year?
The average franchise dealership spent $586,246 on advertising in 2025, according to NADA Data, up 7.8 percent from the year before. That works out to about $48,850 a month across every channel before splitting out digital from traditional.
How much does NADA say dealerships spend per vehicle sold in advertising?
NADA Data puts the 2025 figure at $739 in advertising for every new vehicle a dealership sells, up 4.8 percent from the prior year. A decade earlier, in 2015, the figure was $633 per vehicle.
Is it better to pay an agency a flat fee or a percentage of ad spend?
Neither model is automatically better, but a flat monthly fee removes the incentive for an agency to recommend a bigger budget just to grow its own fee. A percentage-of-spend model can work well too, as long as performance is reported separately from spend so you can tell the difference between a bigger budget and a better one.
How much should a small, single-rooftop dealership budget for digital marketing?
A store selling around 50 new units a month should plan for roughly $27,700 in monthly digital spend, based on NADA's per-vehicle ad cost average and its 75 percent digital share. A newer store, or one in a highly competitive market, often needs to start above that baseline to build search visibility before spend can taper down.
How much should a multi-rooftop dealer group budget for digital marketing?
Apply the same per-vehicle formula across every rooftop. A group selling 250 new units a month combined should plan for roughly $138,600 in monthly digital spend, though shared services like content production and centralized reporting can lower that number somewhat compared to running the same budget across separate, unconnected stores.
How do I know if my dealership is spending too much or too little on marketing?
Compare your total ad spend to your gross revenue. NADA's 2025 average ad-to-sales ratio is 0.77 percent, down from 1.00 percent a decade ago. Spending well below that ratio in a competitive market is a common sign of underspending, while spending well above it can be appropriate for a newer store still building visibility. Track cost per car sold alongside the ratio, since a budget that looks efficient on paper does not always convert into matched sales.
The Right Monthly Marketing Budget Is a Range, Not a Fixed Number
National averages give you a place to start, not a place to stop. NADA's numbers say a typical franchise dealership spends close to $36,600 a month on digital marketing, and the per-vehicle math scales that up or down for your own unit volume. The number that works for your store depends on how competitive your market is, how much ground you need to make up in search, and whether your current agency can show you what each dollar produces, not just what it costs. Start with the benchmarks in this guide, then build a plan around your own cost per car sold instead of a national average alone.